
A Value Manager in a Growth Market
What is a ‘Value Manager’ doing in India? – In our more than 30 years of existence as a firm and more than 20 years of directly managing India dedicated [...]


India’s nominal GDP has steadily grown at 11-12% yearly for the past 20 years. This robust economic expansion has directly fuelled similar double-digit returns for Indian equities. What factors underpin the close linkage between India’s growth story and the rise of its stock markets?
India’s investing argument is very simple. The economy, measured by the GDP, will grow in real terms between 6.0%-6.5% and in nominal terms (including inflation) between 11%-12%.
This annual nominal economic growth is reflected in corporate revenue and profitability; which is then reflected in long-term stock market returns.
(Average rolling CAGR Returns for the given period; Data for the table period 1996-2023,
GDP is Annual, Sensex data is Total Returns, monthly series, CMIE; Bloomberg Finance L.P)
Chart 1: India GDP Growth reflected in Equity Market Returns.
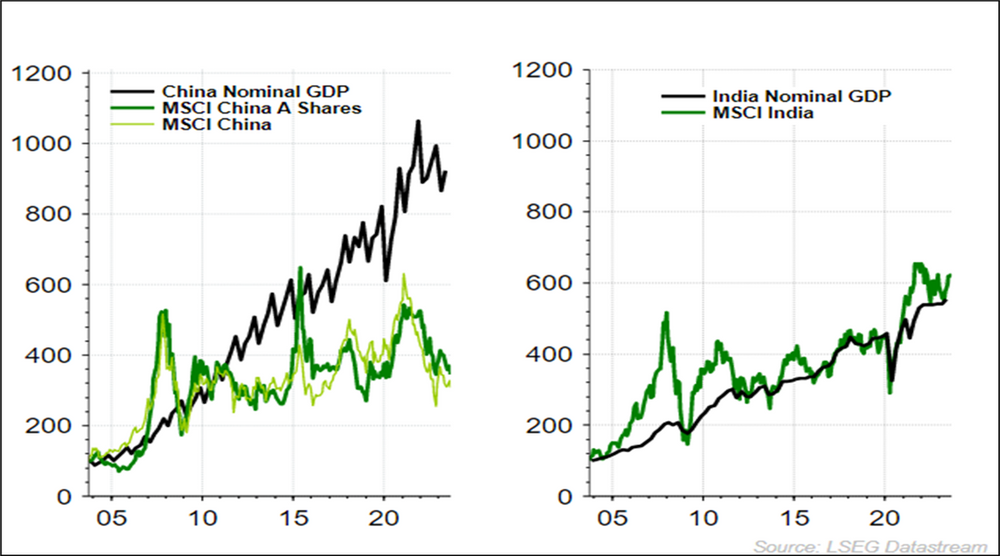
(Source: rebased to 100, 20 year data, in USD)
Investors and clients get this story the moment they see the above chart. This is also the reason why at Quantum we have long believed that Indian Public Equities is the most sensible risk adjusted way to play the India growth opportunity.
A simple long-term allocation to a liquid public equities cognizant of governance risks remains the best allocation. This has the potential to deliver high single digit, low double digit dollar returns.
What is then important is to understand the risks that exist in India. We have always highlighted the risks of governance and of reputation, which led us to build our ‘integrity screen’ back in 1996. A screen to avoid certain managements, business, sectors. The other risk is of liquidity; of investing in private markets or in less liquid listed stocks. And finally the risks of valuation, where we do know that certain companies/sectors can trade at high valuations.
India investments through an Index/ETF, ignores these risks. For instance, Adani and its group companies had a ~6% weight in the MSCI India index. As a fiduciary investor, if that is seen as a ‘headline risk’, you have no control and will have to exit post an event risk.
The Indian indices also tend to be relatively over-valued to the rest of the markets. And we know that high valuations tend to be a potential risk for potential returns.
We know from our experience of managing the strategy over the last 23 years that even in India which is seen a ‘growth’ market, a disciplined approach to building a valuation margin of safety in your investments works over the long-term.
Chart 2: The Quantum Portfolio is not the ‘index’
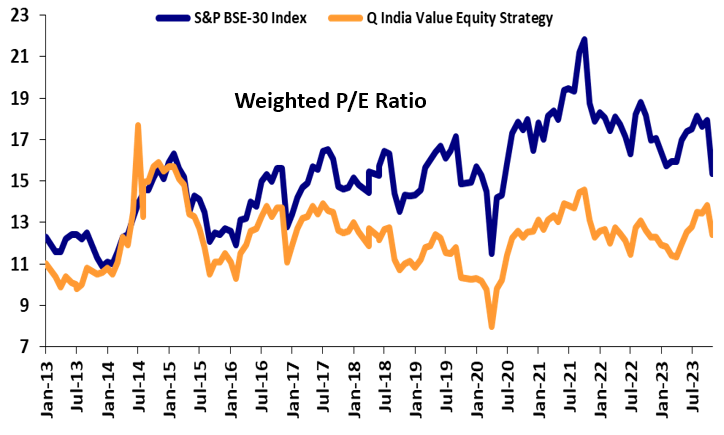
(‘Q India Value Equity Composite’ is a Composite which is an aggregation of client portfolios with a similar investment mandate and with no cash restrictions that are managed or advised by Quantum Advisors on a discretionary basis using the long only public equity strategy. Q India Value Equity Composite does not include all client portfolios due to various client imposed portfolio restrictions, even though all portfolios are managed using the same strategy. Past Performance is not an indicator of future results.. Data as at October 2023)
An allocation thus cognizant of risks of liquidity, governance and valuations remains the sensible approach to take.
A desire for higher returns then means that you add layers of risk – risks of liquidity; risks of valuation; risks of governance; and risks of scalability. The risks in those are visible; the returns though may not always be commensurate.
Chart 3: Public Equities remains the best bet in India
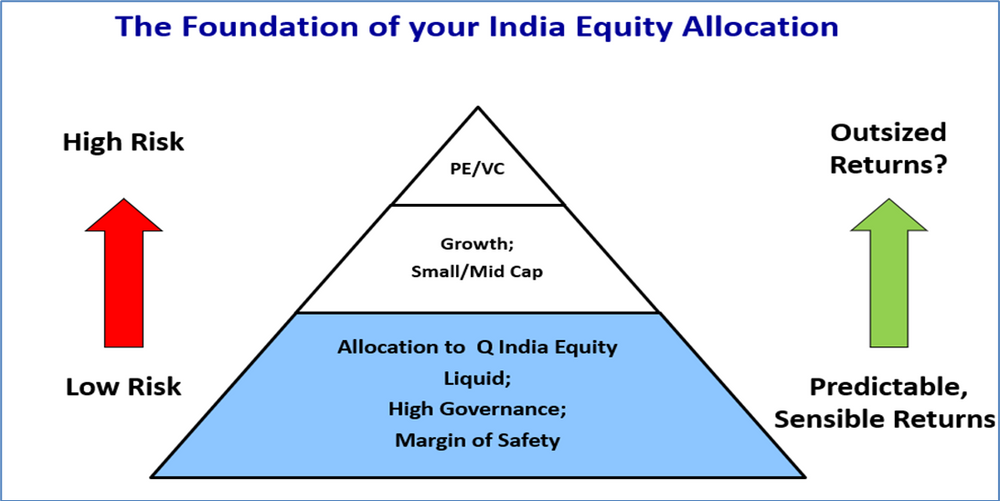
(Source: Quantum Advisors)
It is important to then try and see, what causes this macro nominal growth story to play out in the market returns as well.
We list three broad reasons for it:
India is a micro story helped by a few strong macro trends
Indian economy is broad-based and that is reflected in the market structure and opportunity
Indian corporates have been good at converting broad macro trends to revenues and profits
As we noted in our thematic India@75, Next25, since the 1980s, when India stopped being antagonistic to the private sector, we turned from being a planned, top-down, socialist economy to an economy where private activity and the actions of the individual drove activity.
Chart 4: India over the years
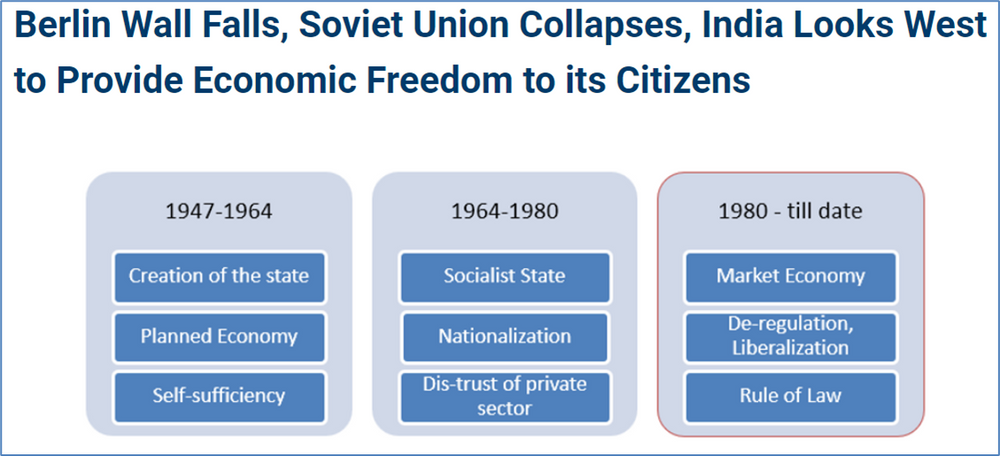
Ex-Agriculture, the share of public sector investment to GDP growth till 1990 was between a third to as high as 50% in certain sectors like heavy industry, mining. Financial services were almost all in the public sector till the reforms of 1990 which then allowed private banks, insurance companies and asset management companies to set shop.
Opening up of manufacturing and services by removing trade barriers further led to the Indian economy being linked to the global economy. De-regulation led to actions of individuals and private businesses driving markets and prices as compared to a ‘babu – Indian bureaucrat’ deciding price and quantity of production and sales.
Government in general is a hindrance to growth and private activity. The Indian state yet looms large. However, empowering and creating institutions like the RBI, SEBI, and sectoral regulators and facilitating rule of law with regulations like the bankruptcy act, right to information, competition commission, ensures that a market economy can function, business can survive and thrive.
India’s growth is driven by the actions of the ~250 million households, the ~800 million working age population, ~500 million employed, the ~50 million enterprises who take risks, consume, invest and save.
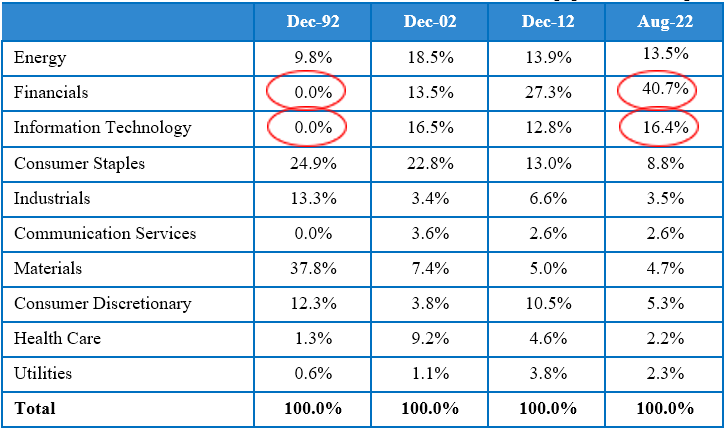
Table 2: Market reflects the evolving economic structure
(Source: CMIE, share for GDP in market prices; 1980 share does not add up to 100 due to rebased new series; All market cap data is based on BSE sectoral indices as at 11-November-2023, actual market cap would be higher; Annual GDP is as of March 2022 data; respective share of GDP in each sector is as per authors’ estimates)
The Indian economy has always been broad-based. As the liberalisation picked up, many more sectors, hitherto out of bounds for the private sector opened up. Two sectors which have opened up, grew rapidly and is representative in the economy and in the stock market indices for eg. are financial services and IT services.
Private Banks had almost zero presence till 1993 and thus had very little share of GDP and market indices. Today, private banks are ~USD 350 billion in market capitalization and financial services has a reasonable share in the GDP data as well.
IT and Software Services is another sector with a market capitalization of ~USD 350 billion, which had zero market capitalization in early 1990s and almost negligible share of GDP then.
Table 3: Indian Indices reflect investor opportunity
Source: Bloomberg, FactSet, Economic times
As these sectors have grown, its share in GDP has increased and so has its representation in market indices and in market returns.
India is getting formalised and networked. Many more businesses which are currently a large part of the economy, for eg: agri linked FMCG, Real Estate, are not as well represented in the stock markets.
However, as competition gets consolidated and businesses formalise, we will so more of these opportunities also being represented in investment portfolios, in market indices and hence in market returns.
We are already seeing, venture capital and private equity money being invested in formalising certain sectors (healthcare, education, financial services) and some of these companies are getting listed improving and increasing the market representation.
Many sectors in India can easily be seen as a factor of GDP. Many analysts will forecast demand for steel, cement, automobiles to be taken as times of real/nominal GDP growth.
Sectors like financial services, tend to be a multiple of money supply which is a function of nominal GDP growth.
Indian corporate profitability as measured through earnings of market indices lead and lag nominal GDP growth, however over the long-term it does tend to reflect broad economic growth.
As chart 4 shows, the growth in earnings of the BSE-500 index is far more sensitive to global and domestic macro changes than the growth in GDP.
Chart 5: Index earnings lead and lag nominal GDP growth
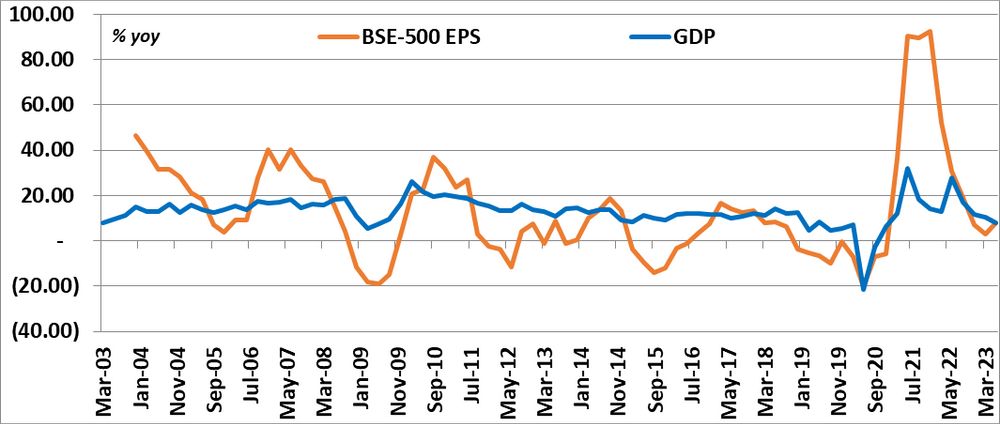
(Source: Bloomberg Finance L.P, CMIE, quarterly % yoy)
Sharp changes in commodity prices, sudden INR depreciation (2008,2013, 2016) or a broad balance sheet adjustment (corporates and banks) as seen between 2013-2019 does impact net corporate profitability. Corporate profitability is also a function of broad investment activity which has its long up and down cycles.
Chart 6: Nominal growth does reflect in earnings and markets
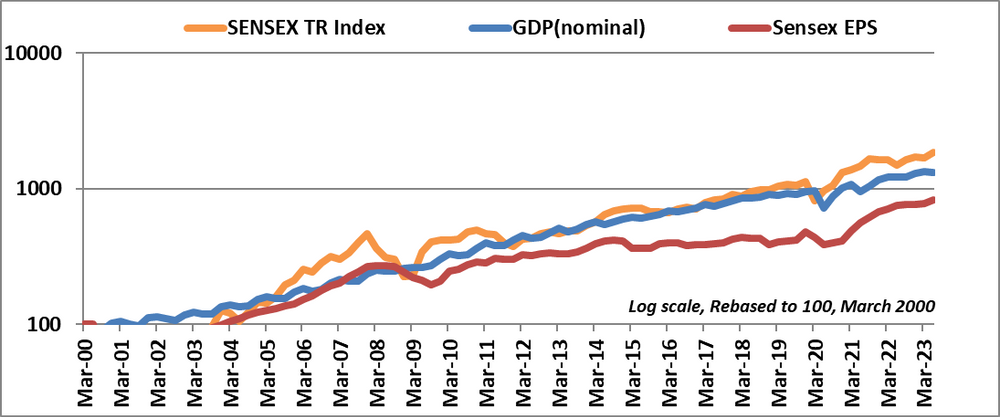
(Source: BSE, CMIE; BSE-30 Sensex Total Returns Index, EPS = Earnings per share trailing 12m, Nominal GDP in market prices, quarterly data, rebased to 100 in March 2000, chart in log scale)
This is why we are able to show this simple table of return expectations from Indian equities for an INR and a USD investor.
The numbers in the above table are based on the assumptions and estimates made by Quantum Advisors Pvt Ltd. “An intelligent portfolio” mentioned above refers to a portfolio constructed by an investment manager following an active approach to investing with an appropriate research and investment process in selecting stocks. These growth rates or indicative rates of return may or may not be achieved. Past performance does not guarantee future results and future performance may be lower or higher than the data given above. Data as at end September 2023


Explore how our two main strategies – Predictable India Equity and India Integrity Equity - with demonstrated success of our tried and tested research and investment processes can ensure your India equity allocation will have higher predictable outcomes and no surprises.
20+ years of India Long-only, Liquid, High-Governance, Margin of safety = Predictability
Integrity screen since 1996, strategy Track record since 2000.
Liquid, proprietary Integrity Scores, Financial Soundness
Integrity Screen since 1996, enhanced criterion since 2015, strategy Track Record since 2019; strategy AuM: $9.7 mn Mandate Capacity: $5 billion

CIN: U65990MH1990PTC055279
SEBI PMS Reg. No.: INP000000187
1st Floor, Apeejay House,
3 Dinshaw Vachha Road, Backbay Reclamation,
Churchgate, Mumbai 400020, India
Tel: +91-22-6144 7900 / 22830322
Fax : 91-22-2285 4318
Email: info@QASL.com
In case of any grievance/complaint, you may contact Mr. Piyush Thakkar, Chief Executive Officer at Complaint@qasl.com. Investor can initiate dispute resolution by harnessing online conciliation and/or online arbitration through Online Dispute Resolution (ODR) portal SMARTODR. To know more about grievance redressal mechanism click here.
© 2024 Quantum Advisors India | Designed and developed by Solharbor