
A Value Manager in a Growth Market
What is a ‘Value Manager’ doing in India? – In our more than 30 years of existence as a firm and more than 20 years of directly managing India dedicated [...]


Global wealth is estimated at over USD 250 trillion. Long term investors like Public Pension Funds and Sovereign Wealth Funds account for over USD 50 trillion in assets. The other large pie is of insurance companies. The largest pool is of course of individuals, high net worth and retail.
Most of the wealth is invested in the home country. However, money chases opportunities and returns. Investors seek higher growth destinations. Many investors look at global GDP weights to plan their asset allocation.
What should be India’s share of the global wealth and assets under management? India has a ~3% share of the global GDP calculated on dollar exchange rates. In PPP terms, India’s share of global GDP is ~7%. If investment portfolios are duly diversified as per economic opportunity, India should command a 2% weightage in global asset allocation. Foreign investments in India should then have been around ~USD 5 trillion.
As of March 2022, Portfolio flows into Indian Equity, Debt and Hybrid instruments in India and through depository receipts amounted to USD 670 billion. If we include FDI, Private Equity and Venture Capital into Indian Equity, Debt and Hybrid instruments the total investments in market value may go up to ~USD 1.5 trillion. Foreign Investors thus are under-allocated to India when compared to the global opportunity asset pool.
Global Long-term investors are also yet to discover the potential and opportunities in India. We argue in this piece that these investors need to increase their allocation to India and recommend an ideal asset allocation.
Table 1: Global Large Pools of Capital are under-allocated to India
(Source: PWC Global Wealth study, Towers Watson, Credit Suisse wealth report, OECD, Quantum estimates, As at March 2022)
Table 2: Global Pension Funds are grossly under-invested in Indian capital markets.
Source: Foreign Portfolio Investments in India; NSDL, (*) Debt includes VRR allotments not invested, data till March 2022, INR/USD =76)
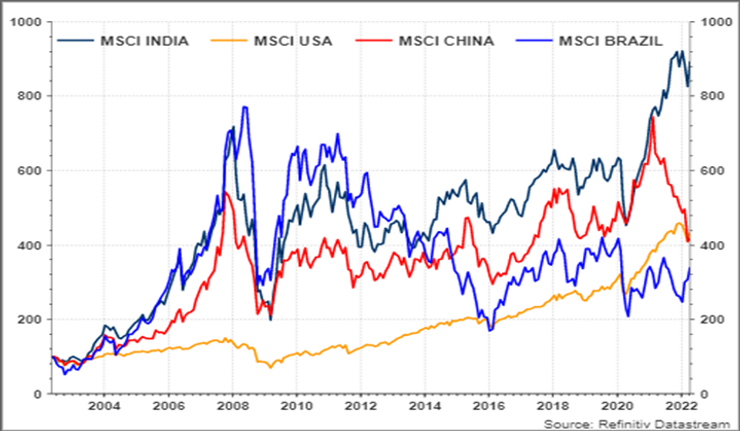
The under-allocation over the years has meant that investors have missed out on Indian equities outperformance
Chart 1: Global Allocators continue to miss India’s outperformance

Source: 20 year Data from September April 2002 to April 2022, All MSCI Indices, Rebased to 100 ;, all data in USD
Chart 2 and 3: Rather than a ‘BRIC’ or ‘EM’ mandate, consider a dedicated India mandate
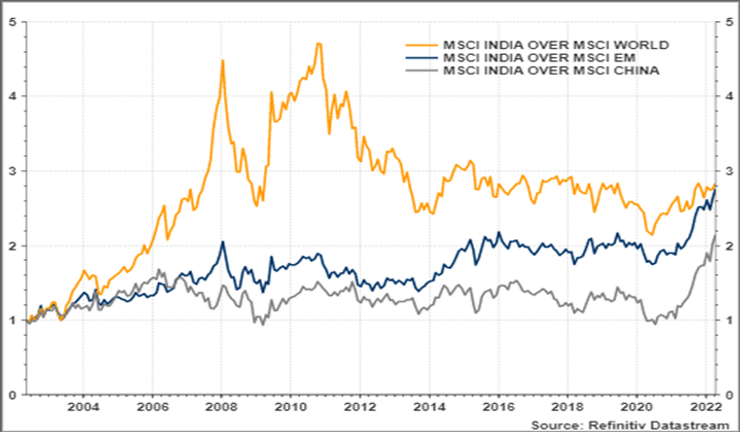
Source: 20 year Data from September April 2002 to April 2022, All MSCI Indices, Rebased to 100 in; all data in USD
Investors do indeed follow growth potential as witnessed in the increase in direct and portfolio flows into China. Many global investors built up a dedicated mandate to invest in China. Over the last 15 years, as China opened up its capital markets, foreign money has gushed into equities and recently into bonds.
Chart 4: Unlike China, India’s growth potential is reflected in market returns
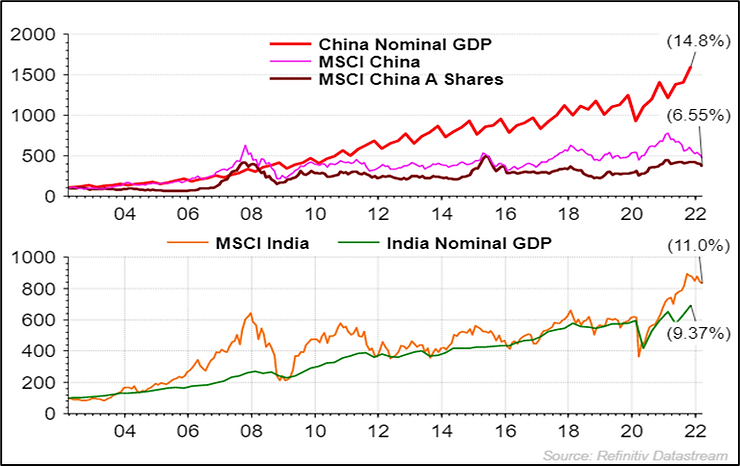
Source: Refinitiv DataStream, Data in USD, rebased to 100, 20 years ago, Quarterly Data, GDP till December 2021 and Markets Data
Chart 6:India’s 3 decades of continued reform will make India the next China

(Source: Worldbank, RBI and www.parliamentofindia.nic.in as of December 2021.)
India’s GDP is ~USD 2.7 trillion. The per-capita income though remains around the USD 2,000 level. We remain confident of India being able to grow above the 6% real GDP level. As that happens, per-capita incomes increase boosting savings and consumption. The investment opportunity for a global long-term investor thus gets larger.
India will become the fourth largest economy by 2025 and its share in global GDP will continue to rise.
Source: RBI, CMIE, Quantum Estimates
India growth potential transcends into corporates earnings and stock market returns. The more than 4,000 listed companies in India’s stock markets are representative of the underlying economy. A robust capital markets, both in equity and debt, well governed and open to foreign participation. Domestic investor participation has been increasing with the growth in size of mutual funds and insurance companies.
Table 4: India has the size, growth and the long-term returns.
(Source: Total Returns Index, % YoY returns on monthly data, averaged for the time period, period ending 30-April-2022)
Driven by the returns and as India becomes more mainstream in investment portfolios, India can attract significant flows. Even If global investors allocate 2% of their overall portfolio to India over time across Equity, Fixed Income, Real Estate and Infrastructure, India should receive inflows in excess of over USD 3 trillion.
Table 5: Prepare to allocate more to India in the coming years based on its GDP potential
(Source: Quantum Estimates, Equity Index = MSCI World Index; India is not included in global bond index, but is expected to have a weight of between 0.5%-1.0% if included; In the MSCI EM Equity index, India has a weight of ~9.25% and is expected to have a 10% weight of an EM bond Index on an eventual inclusion)
Today, Foreigners about ~20% of the total India stock market by capitalization. Foreigners own less than ~3% of the Indian Bond market. The Indian stock market capitalization is ~+USD 3.0 trillion. The Indian Bond markets are ~+USD 2 trillion.
Indian public markets are thus large and have substantial absorptive capacity. Public markets are also liquid and access is easier and exits have no particular restrictions.
However, as the data in the next chart shows, India has received as much inflows into private equity/venture capital as it has in listed public equities. The data on PE also includes investment flows into Infrastructure and Real Estate. The opportunity size of Private companies, start-ups, real estate and infrastructure is larger.
However, the access, the ease of investing and the potential for exits are difficult. From governance issues of trusting the partner/investee company to regulatory challenges to dealing with the lack of liquidity and exits has plagued the investor community. There have been successes of course, however a similar risk/return profile is on offer in the public markets at better governance, easier regulatory system and higher liquidity and exits.
Chart 6 and 7: India’s private markets are absorbing higher inflows than public markets
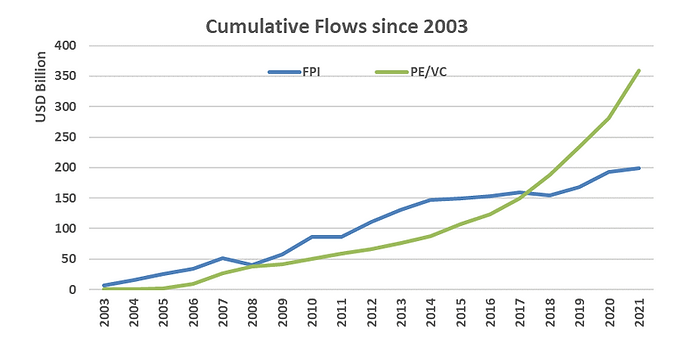
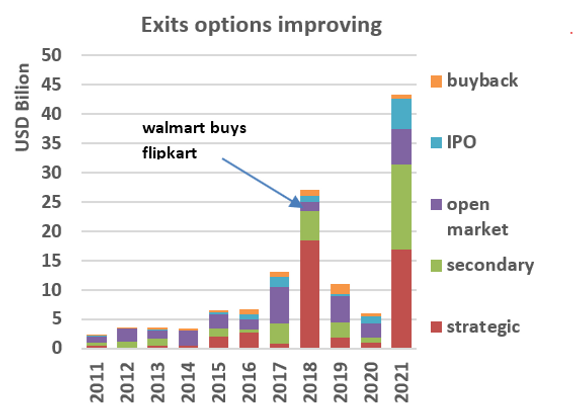
(Source: NSDL, EY report on India Private Equity and Venture Capital Industry: some PE investments may have also been counted in FPI)
We have believed that Investors would be benefitted by having a higher allocation to listed, liquid public equities over private equity and sovereign/quasi sovereign bonds over credit. However, as the economy and the markets mature , investor depth improves and the ecosystem develops, we do believe clients who can deal with illiquidity and long-gestation can also look at private asset investing in India.
Chart 8: Opportunities across Asset class: Be Mindful of risks of illiquidity and partner selection

(Source: Quantum Estimates; Allocation as a % of your India Portfolio)
Annexure
Table A: India has the size, growth and the long-term macro-opportunity.
Source: CMIE, RBI, Quantum Estimates, Data as at December 2020
Chart A: India will be a large part of the global economy; you cannot ignore it.

Source: Quantum Advisors Angus Maddison, University of Groningen
For more information and if you wish to discuss the details in the article or if you wish to know more about our investment strategies, the investment philosophy and investment opportunities, please contact:
Arvind Chari – Arvind@Qasl.com
Arvind Chari is the Chief Investment Officer (CIO) at Quantum Advisors. Arvind’s vast experience in managing money for global investors and his interactions with leading institutions has exposed him to a world of knowledge. With over 18 years of experience in tracking domestic and global economy he is Quantum’s thought leader and is the author of this Q-India Insight edition.
Disclosure Statement
The views are not meant to serve as a professional guide / investment advice / intended to be an offer or solicitation for the purchase or sale of any financial product or instrument for the recipient. Whilst no action has been solicited based upon the information provided herein, due care has been taken to ensure that the facts are accurate and views given are fair and reasonable as on date. Recipient should rely on information/data arising out of their own investigations and advised to seek independent professional advice and arrive at an informed decision before making any investments. This is neither an offer to sell securities of any investment fund nor a solicitation of an offer to buy any securities.

Explore how our two main strategies – Predictable India Equity and India Integrity Equity - with demonstrated success of our tried and tested research and investment processes can ensure your India equity allocation will have higher predictable outcomes and no surprises.
20+ years of India Long-only, Liquid, High-Governance, Margin of safety = Predictability
Integrity screen since 1996, strategy Track record since 2000.
Liquid, proprietary Integrity Scores, Financial Soundness
Integrity Screen since 1996, enhanced criterion since 2015, strategy Track Record since 2019; strategy AuM: $9.7 mn Mandate Capacity: $5 billion

CIN: U65990MH1990PTC055279
SEBI PMS Reg. No.: INP000000187
1st Floor, Apeejay House,
3 Dinshaw Vachha Road, Backbay Reclamation,
Churchgate, Mumbai 400020, India
Tel: +91-22-6144 7900 / 22830322
Fax : 91-22-2285 4318
Email: info@QASL.com
In case of any grievance/complaint, you may contact Mr. Piyush Thakkar, Chief Executive Officer at Complaint@qasl.com. Investor can initiate dispute resolution by harnessing online conciliation and/or online arbitration through Online Dispute Resolution (ODR) portal SMARTODR. To know more about grievance redressal mechanism click here.
© 2024 Quantum Advisors India | Designed and developed by Solharbor